• Home
  • Our Listings
    • Marty’s Listings
    • Aaron’s Listings
    • Charlie’s Listings
  • Prior Sales
  • Sellers
    • Sellers
    • Metro Markets
    • Selling a Home
    • Home Helpers
  • Buyers
    • Buyers
    • Mortgage Calculators
    • Schools
    • Home Helpers
    • Home Inspections
    • Home Buying
  • Meet Marty
    • Testimonials
  • Contact Us
    • Contact Marty
    • Contact Aaron
    • Contact Charlie
  • Search
Homes

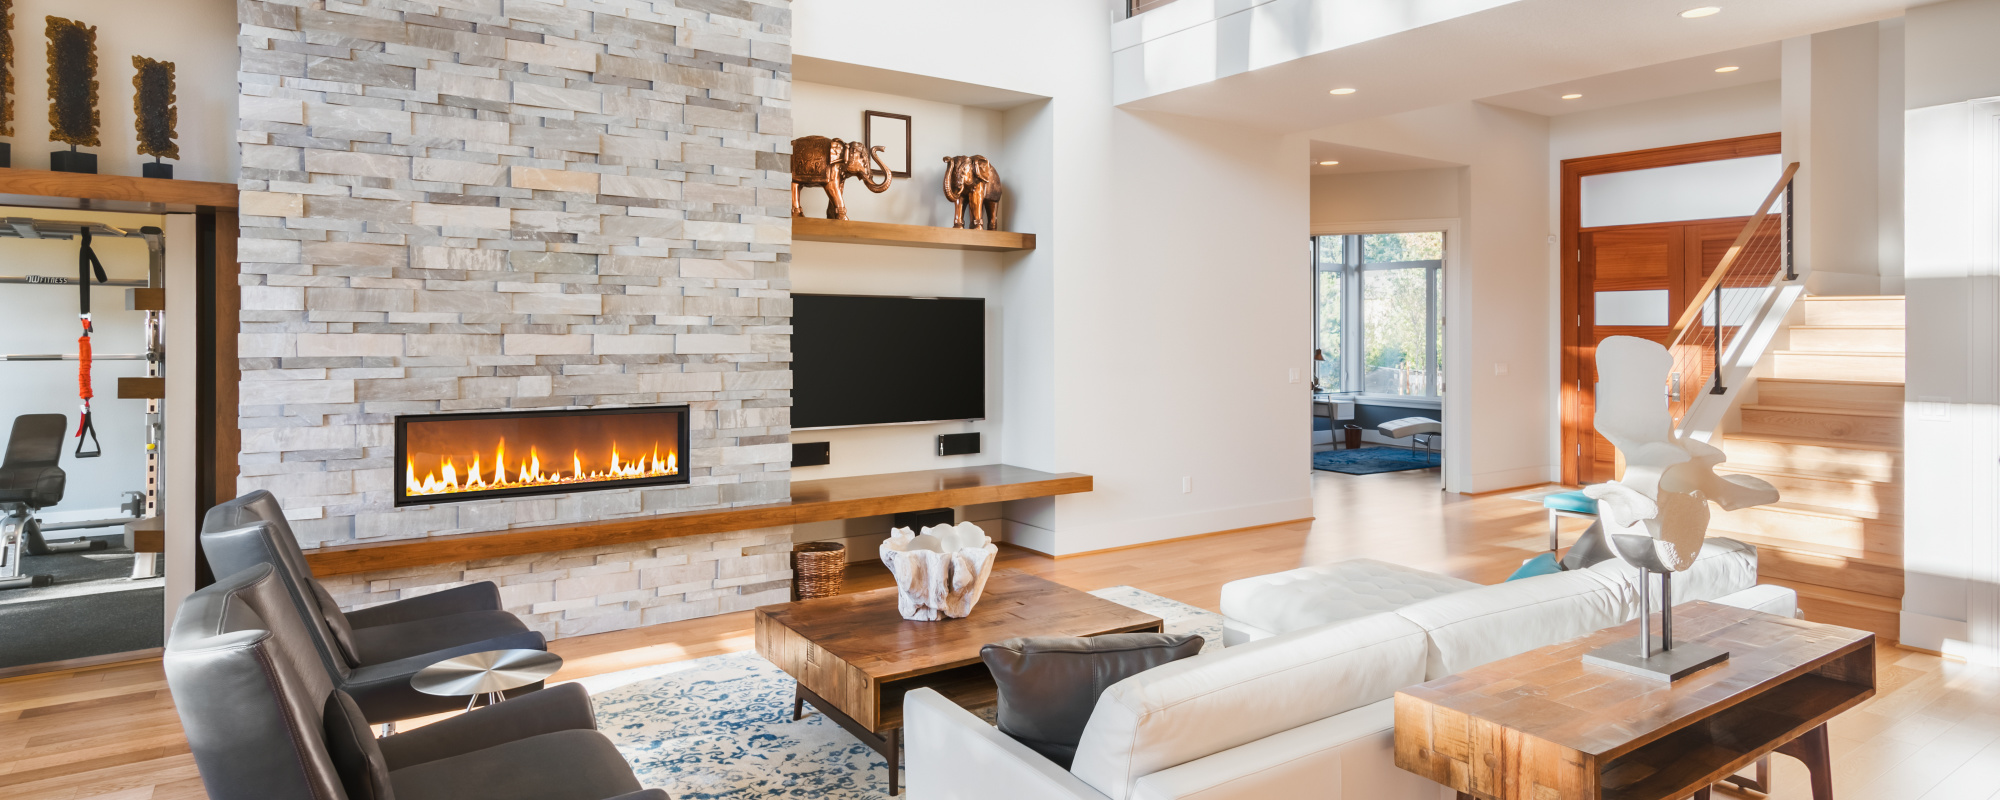
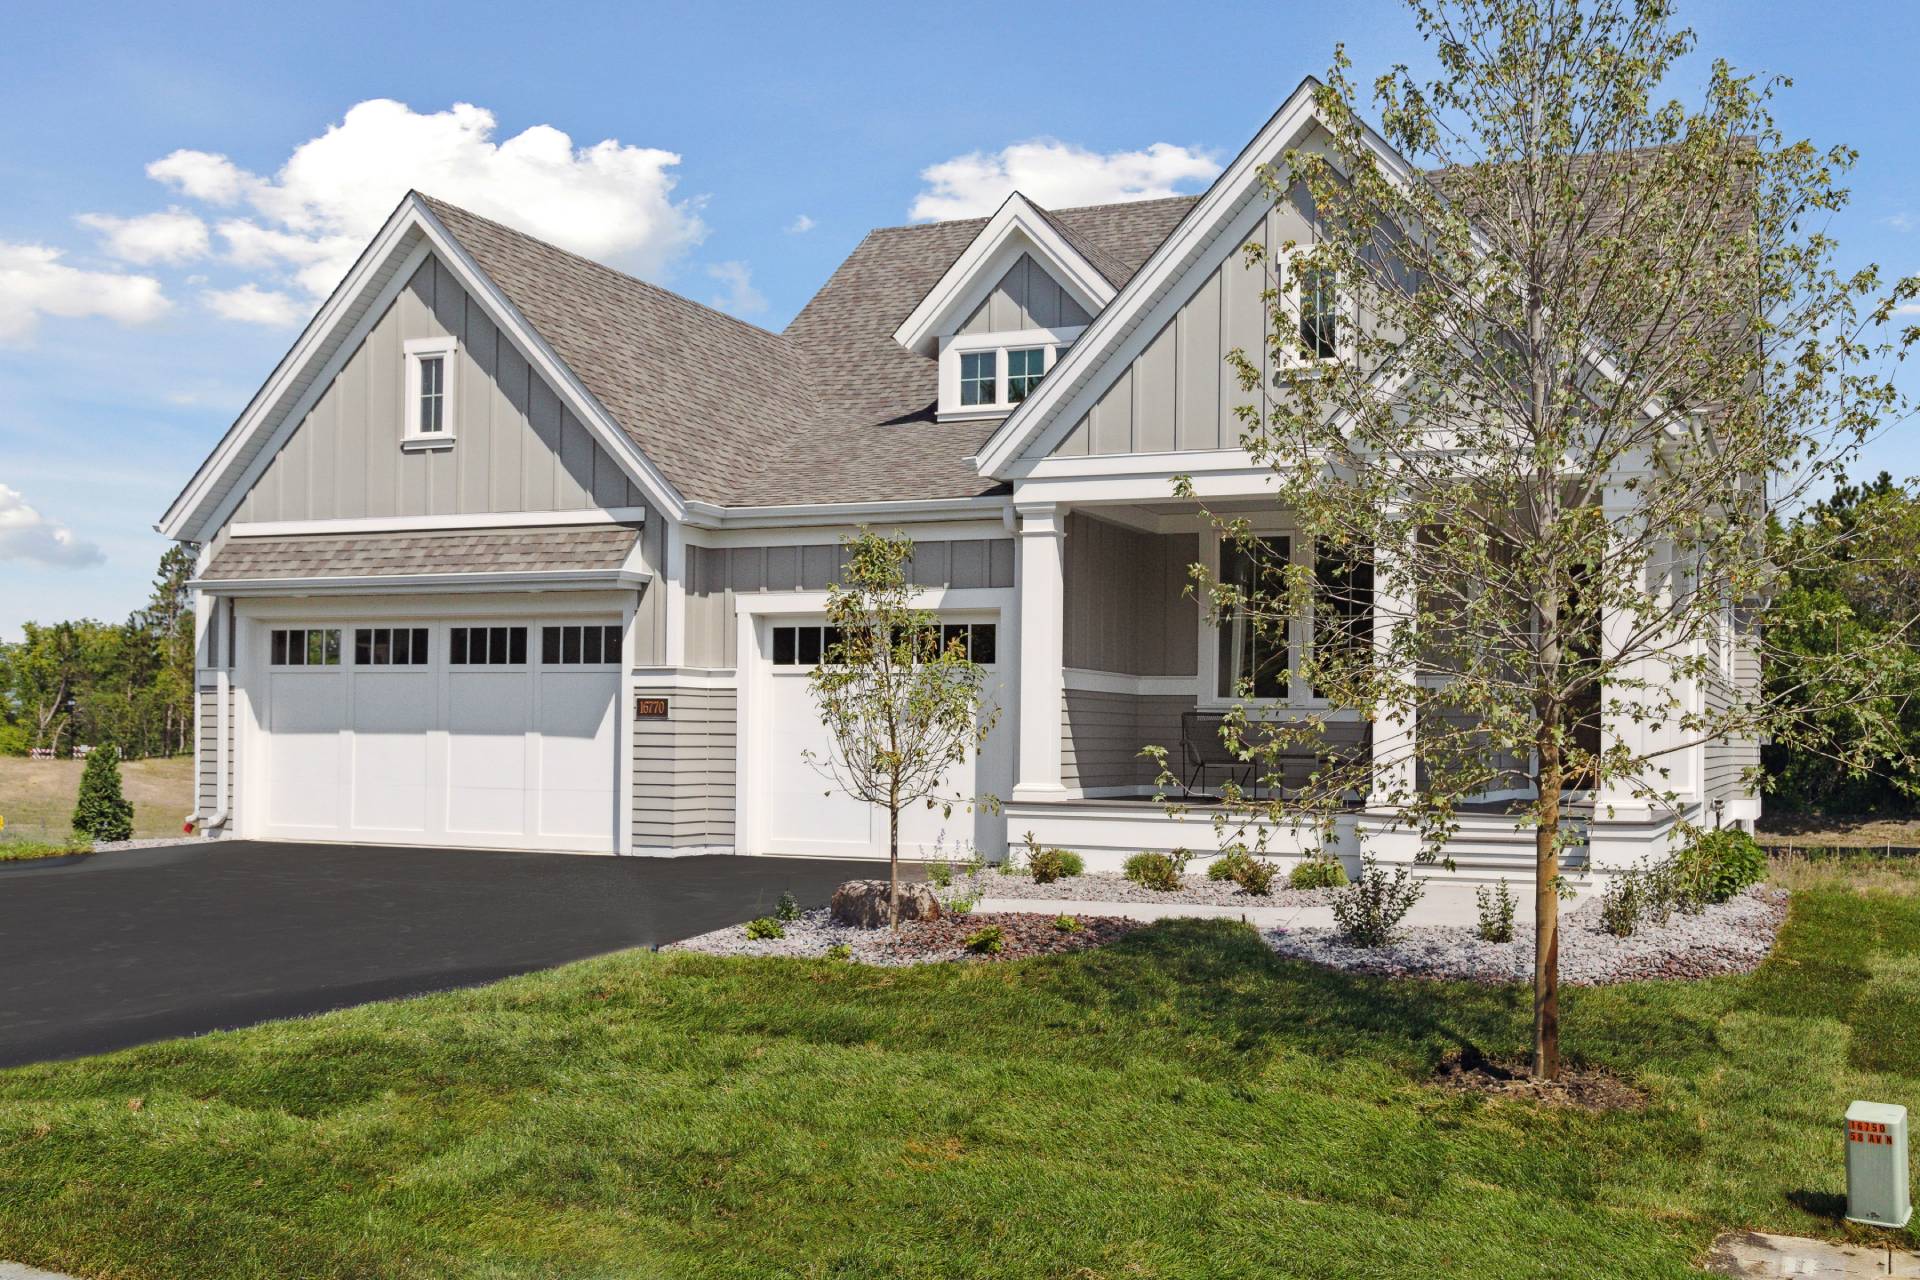
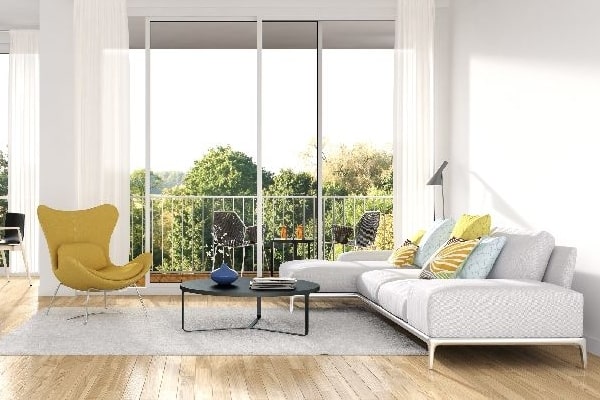
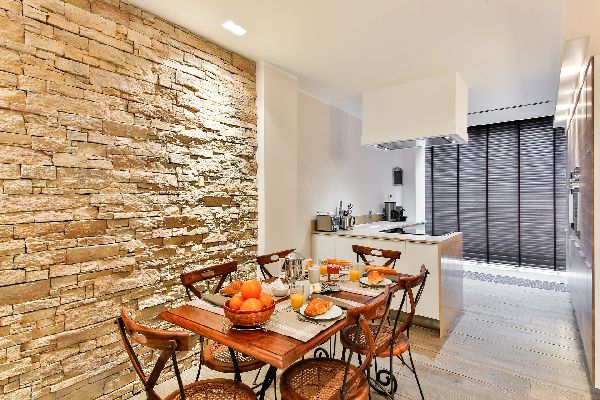
The Siegel* Ritchie Team is proud to announce they will be the exclusive representatives of the new Charles Cudd Villa Homes located in Plymouth! Contact us immediately for information regarding these 21 spectacular homesites bordered by trails, parks and mature trees, with packages priced from approximately $1,105,000 to $1,350,000 . There are 14 walkout lots, 6 lookout lots and 1 slab-on-grade lot, located on Dunkirk Lane in Plymouth (GPS 5815 Dunkirk Lane) for location specific directions. Experience for yourself why Cudd is recognized as one of the premier builders in the metro area. Call us to arrange a model tour and to see specific lots, floor plans and options available for your selection.

Learn More
  • « Previous Page
  • 1
  • …
  • 102
  • 103
  • 104
  • 105
  • Next Page »

Weekly Market Report

Home prices are still rising and rates have increased incrementally. As the cement of market balance hardens, it has become more dependent on move-up and first- time home buyers. Even with tightened lending regulations, seller activity has broadened. The government shutdown should not have a major impact on national and local market housing recovery. But as we get deeper into the -ber months, it will be interesting to see if the year-over-year trends hold true, simply lessen in drama or give reason for pause.

In the Twin Cities region, for the week ending September 28:

  • New Listings increased 10.3% to 1,449
  • Pending Sales increased 12.2% to 1,106
  • Inventory decreased 5.9% to 16,282

For the month of August:

  • Median Sales Price increased 16.8% to $207,825
  • Days on Market decreased 34.0% to 70
  • Percent of Original List Price Received increased 2.0% to 97.0%
  • Months Supply of Inventory decreased 15.9% to 3.7

Click here for the full Weekly Market Activity Report.From The Skinny.

Weekly Report

Weekly Market Report

Higher interest rates, rising prices and a budget standoff in Washington haven’t shaken consumer sentiment regarding housing. Buyers continue to riffle through existing inventory for options, keeping an eye out for new listings. A sense of normalcy is returning to the real estate ethos after more than a decade of extreme ups and downs. It’s a big week for economic and housing news, so keep your eyes and ears tuned for any changing headlines.

In the Twin Cities region, for the week ending September 21:

  • New Listings increased 13.3% to 1,469
  • Pending Sales decreased 5.5% to 970
  • Inventory decreased 6.8% to 16,249

For the month of August:

  • Median Sales Price increased 16.9% to $207,900
  • Days on Market decreased 34.0% to 70
  • Percent of Original List Price Received increased 2.0% to 97.0%
  • Months Supply of Inventory decreased 18.2% to 3.6

Click here for the full Weekly Market Activity Report.From The Skinny.

Weekly Report

September Monthly Skinny Video

Where has the Twin Cities real estate market been and where is it heading? This monthly summary provides an overview of current trends and projections for future activity. Video produced by Chelsie Lopez.

Monthly Skinny Video

Weekly Market Report

For several weeks, markets across the country have seen consistent gains in sales, prices and percent of list price received at sale. Things like steadily low rates, less lender-mediated inventory and increased consumer confidence are all helping this reality. Each and every week reveals signs of a recovered market that are going from temporary yard sign to permanent road sign. Here’s to hoping for prosperous signs on the road ahead.

In the Twin Cities region, for the week ending September 14:

  • New Listings increased 19.5% to 1,625
  • Pending Sales increased 8.3% to 1,006
  • Inventory decreased 8.0% to 16,095

For the month of August:

  • Median Sales Price increased 16.9% to $207,900
  • Days on Market decreased 34.0% to 70
  • Percent of Original List Price Received increased 2.0% to 97.0%
  • Months Supply of Inventory decreased 18.2% to 3.6

Click here for the full Weekly Market Activity Report.From The Skinny.

Weekly Report

Weekly Market Report

A pendulum spends little time in the middle. It tends to overswing center and hang out at the extreme before changing directions. Apply that to housing. Two or three years ago, almost no one would have foreshadowed concern over affordability, yet that’s what some are cautioning against in an environment of rising prices and interest rates. It would take further increases to truly rattle confidence and sentiment, but it’s wise to monitor the market recovery’s dual-edged saber.

In the Twin Cities region, for the week ending September 7:

  • New Listings increased 18.6% to 1,511
  • Pending Sales decreased 4.5% to 857
  • Inventory decreased 8.9% to 15,891

For the month of August:

  • Median Sales Price increased 16.9% to $207,900
  • Days on Market decreased 34.0% to 70
  • Percent of Original List Price Received increased 2.0% to 97.0%
  • Months Supply of Inventory decreased 18.2% to 3.6

Click here for the full Weekly Market Activity Report.From The Skinny.

Weekly Report

Foreclosure and Short Sales at Lowest Level Since 2007

6a00e54ee9620b8834019aff58559a970d-800wiTwin Cities home buyers were unflustered by slightly higher interest rates in August as pending sales were up 10.9 percent to 5,244. Along with rising prices, increased sales activity is fueling housing demand, while buyers continue to watch inventory levels for more options.

New listings rose 16.5 percent to 6,951, marking the fifth consecutive year-over-year increase in seller activity. Buyers have 15,773 properties from which to choose – 9.9 percent fewer than August 2012 but 21.2 percent more than in January 2013.

The overall median sales price was $208,000, up 16.9 percent compared to August 2012. A shift in sales type is driving this price growth. At this time last year, foreclosures and short sales together comprised 35.8 percent of all sales activity. In August 2013, these two distressed segments made up just 20.7 percent of all sales. On the seller side, the percentage of all new listings that were distressed in August fell to 17.8 percent, down from 32.7 percent in 2012.

While closed sales were up 8.9 percent overall, traditional buyer activity was up 34.7 percent. Foreclosure sales and short sales were down 34.5 and 43.5 percent, respectively. Similarly, new listings were up 16.5 percent overall, but traditional seller activity rocketed 42.1 percent higher. Foreclosure new listings fell 31.4 percent and short sale new listings fell 46.0 percent. With 18 straight months of year-over-year median price gains, multiple-offer situations still common and 3.6 months’ supply of inventory, few thought that the pendulum would swing this far this fast. Homes are selling in an average of 70 days – the quickest pace in six and a half years. Sellers are receiving an average of 97.0 percent of their original list price – the highest ratio in approximately seven years.

The traditional median sales price rose 3.7 percent to $228,000; the foreclosure median sales price was up 14.1 percent to $140,400; the short sale median sales price increased 13.4 percent to $142,608. On average, traditional homes sold in 62 days for 97.2 percent of original list price, foreclosures sold in 79 days for 97.1 percent of original list price and short sales lagged at 163 days and 94.2 percent of original list price.

The Skinny

Weekly Market Report

Whether it’s accommodative monetary policy, the promise of less shadowy shadow inventory or increased economic recovery, U.S. housing continues along a path of sustainable growth. Rising prices are drawing otherwise
reluctant or previously underwater sellers. And buyers are grateful for any additional supply. Intervention from the Fed may or may not be on the horizon. Nonetheless, there’s reason to be confident in positive market longevity.

In the Twin Cities region, for the week ending August 31:

  • New Listings increased 16.3% to 1,359
  • Pending Sales increased 22.9% to 1,243
  • Inventory decreased 9.3% to 16,081

For the month of August:

  • Median Sales Price increased 16.9% to $208,000
  • Days on Market decreased 34.0% to 70
  • Percent of Original List Price Received increased 2.0% to 97.0%
  • Months Supply of Inventory decreased 18.2% to 3.6

Click here for the full Weekly Market Activity Report.From The Skinny.

Weekly Report

Weekly Market Report

So far this summer, housing has achieved a soft, warm glow. If healing growth in the economy and labor markets persists, housing will be more than ready to weather tapering Fed activity – regardless of when it comes. Both local and national market indicators can’t yet contradict any confidence in rising home prices or dwindling inventory supplies. Let’s take a look into your locale to see how residential real estate is faring.

In the Twin Cities region, for the week ending August 17:

  • New Listings increased 27.8% to 1,643
  • Pending Sales increased 8.7% to 1,173
  • Inventory decreased 10.1% to 16,124

For the month of July:

  • Median Sales Price increased 16.8% to $208,000
  • Days on Market decreased 31.4% to 72
  • Percent of Original List Price Received increased 2.6% to 97.5%
  • Months Supply of Inventory decreased 19.6% to 3.7

Click here for the full Weekly Market Activity Report.From The Skinny.

Weekly Report

August Monthly Skinny Video

Where has the Twin Cities real estate market been and where is it heading? This monthly summary provides an overview of current trends and projections for future activity. Narrated by David Arbit (Research Manager, Minneapolis Area Association of REALTORS® & 10K Research), video produced by Chelsie Lopez.

Monthly Skinny Video

Weekly Market Report

In the world of costs and benefits, no good deed goes unpunished and every rain cloud has a silver lining. The Commerce Department recently reported that consumer retail spending had risen the most in seven months. That bodes well for residential real estate – an industry sensitive to consumer confidence and spending levels.

But it could force the Federal Reserve’s hand in tapering stimulatory monetary policy sooner than later, something that could push interest rates off their current lows.

In the Twin Cities region, for the week ending August 10:

  • New Listings increased 19.1% to 1,650
  • Pending Sales increased 10.1% to 1,197
  • Inventory decreased 11.3% to 15,990

For the month of July:

  • Median Sales Price increased 16.8% to $208,000
  • Days on Market decreased 31.4% to 72
  • Percent of Original List Price Received increased 2.6% to 97.5%
  • Months Supply of Inventory decreased 21.7% to 3.6

Click here for the full Weekly Market Activity Report.From The Skinny.

Weekly Report

  • « Previous Page
  • 1
  • …
  • 102
  • 103
  • 104
  • 105
  • Next Page »

Marty Siegel REALTOR, CRS,GRI

Direct: 952.844.6156
Cell: 612.670.3839
E-mail: TCRealtor@aol.com
Coldwell Banker Realty
7550 France Ave. S
Edina, MN 55435
DAVID KAMPIC SIEGEL ENDOWMENT FUND INFORMATION
  • Weekly Market Reports
  • Building a Home
  • Schools
  • Communities
  • Custom Search
  • What is Your Home Worth?
  • Relocation

Contact Us

All information deemed reliable but not guaranteed and should be independently verified.

Powered By WordPress | Copyright 2013 MightyAgent