For Week Ending March 21, 2026
U.S. housing starts rose 7.2% month-over-month to a seasonally adjusted annual rate of 1,487,000 units, up from a revised 1,387,000 in December, according to the U.S. Census Bureau. The latest reading marks the third consecutive monthly gain and the highest level since February 2025. On a year-over-year basis, housing starts grew 9.5%.
In the Twin Cities region, for the week ending March 21:
- New Listings decreased 7.0% to 1,293
- Pending Sales decreased 5.5% to 934
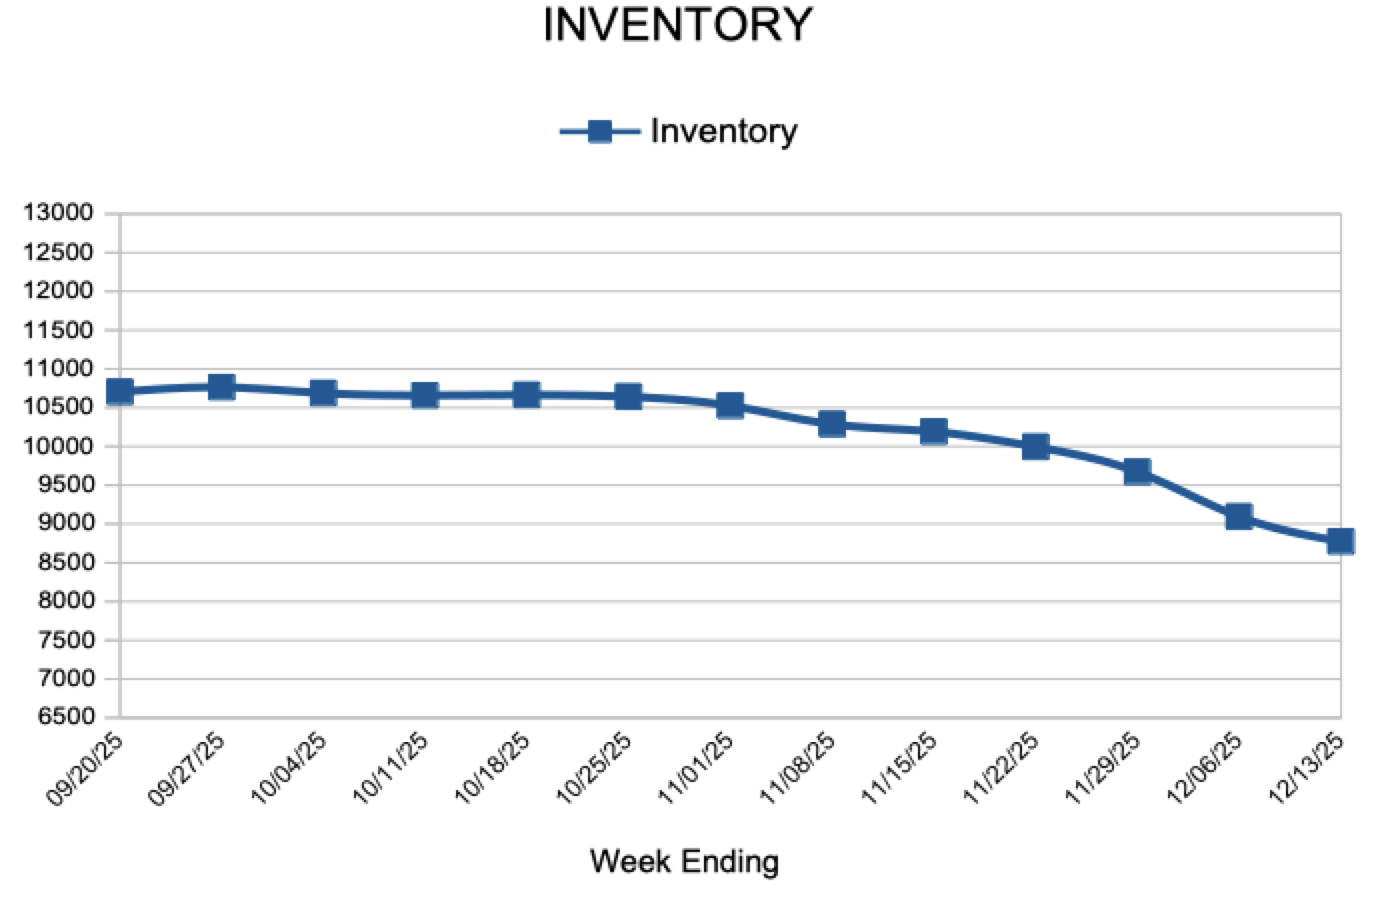
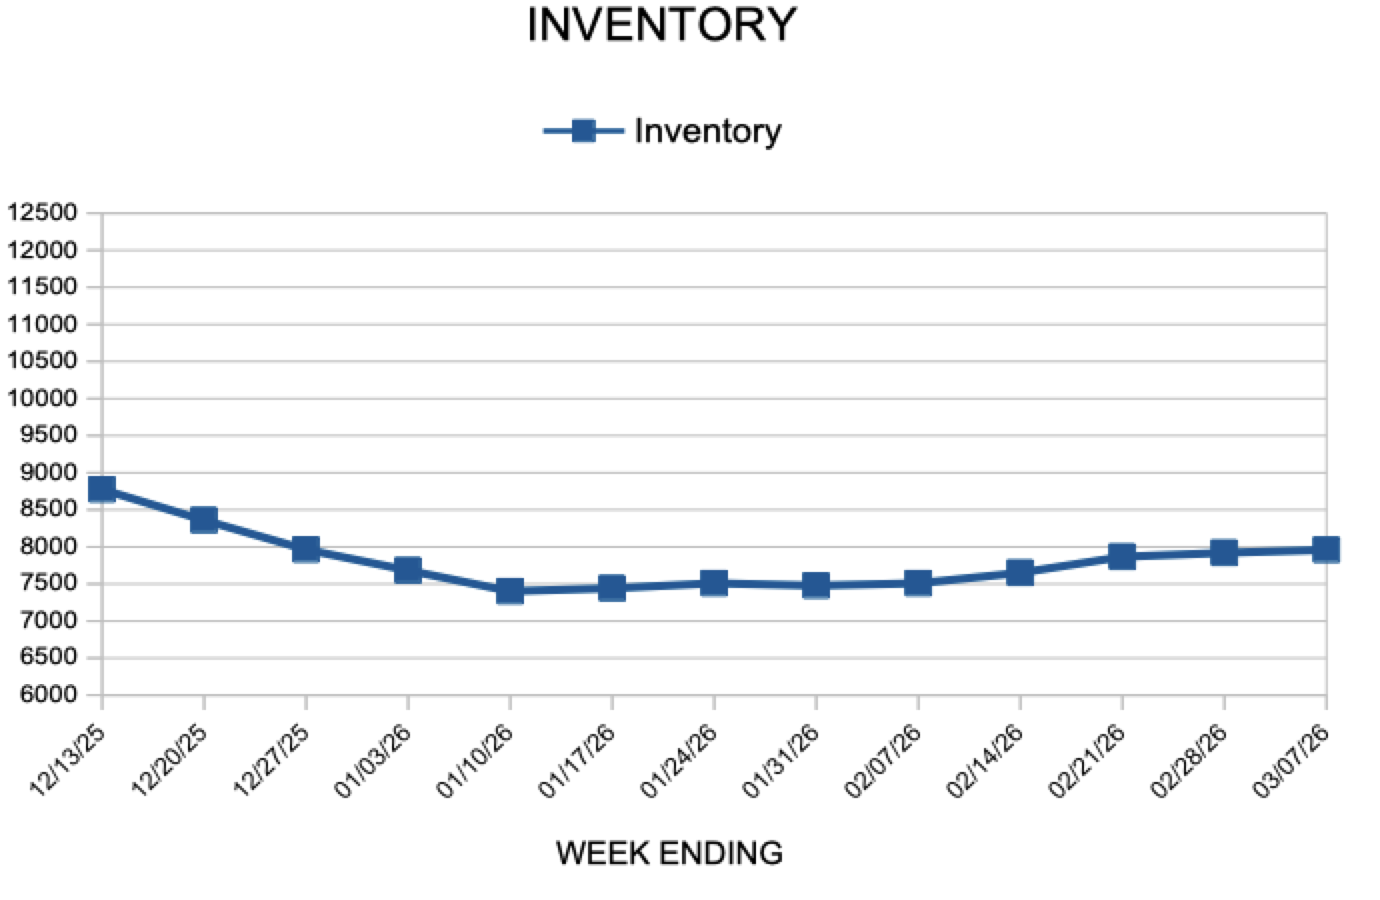
- Inventory increased 3.7% to 8,460
For the month of February:
- Median Sales Price remained flat at $380,000
- Days on Market remained flat at 69
- Percent of Original List Price Received decreased 0.3% to 97.4%
- Months Supply of Homes For Sale increased 4.8% to 2.2
All comparisons are to 2025
Click here for the full Weekly Market Activity Report. From MAAR Market Data News.


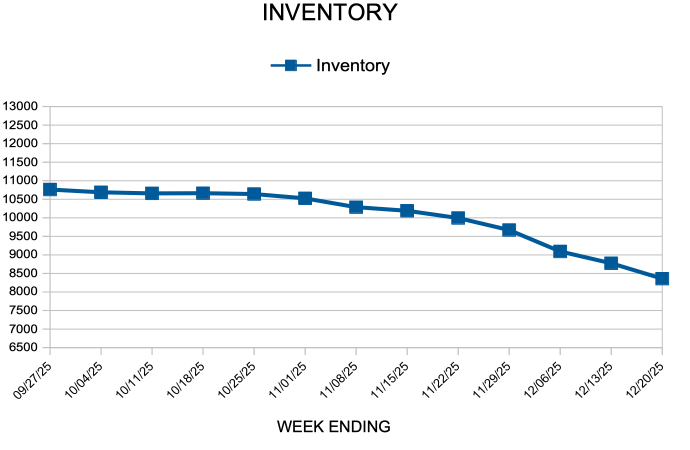
 For Week Ending December 20, 2025